Introduction
- Clarista is a web application tailored for both data scientists and business analysts, aiming to streamline the complexities within data teams.
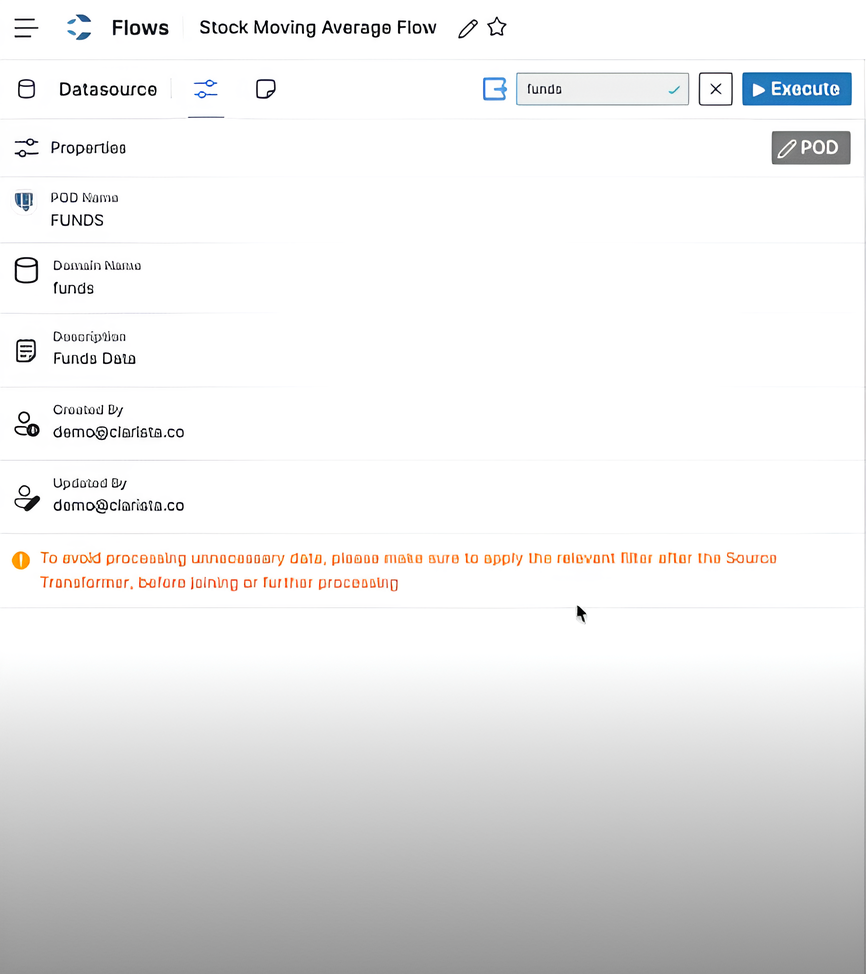
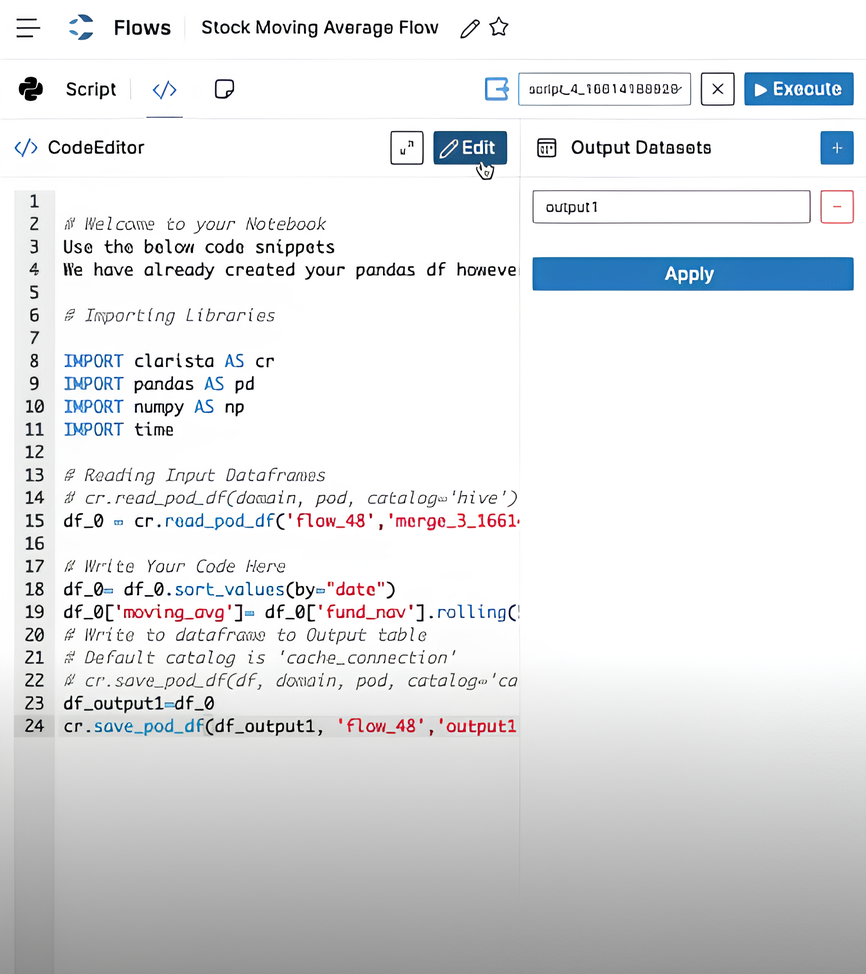
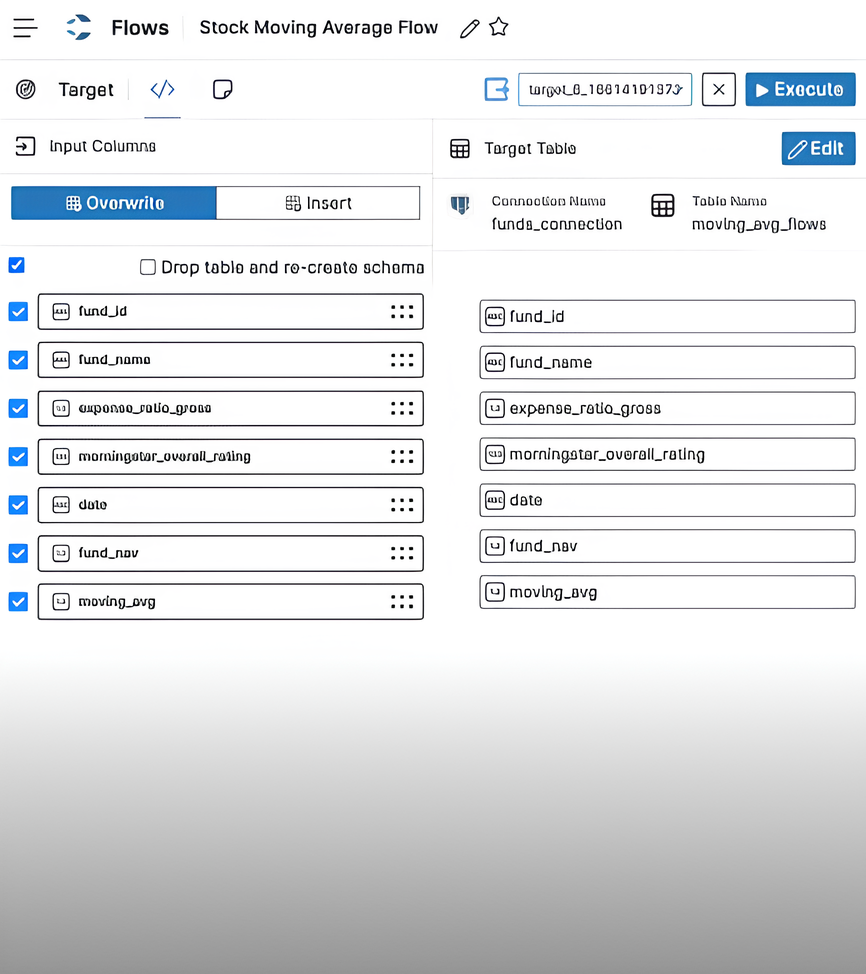
- Among its notable features, Flows stands out in Clarista, offering users the ability to conduct data transformations effortlessly, without the need for coding. Through an intuitive drag-and-drop interface, users can seamlessly execute various operations without writing a single line of code.
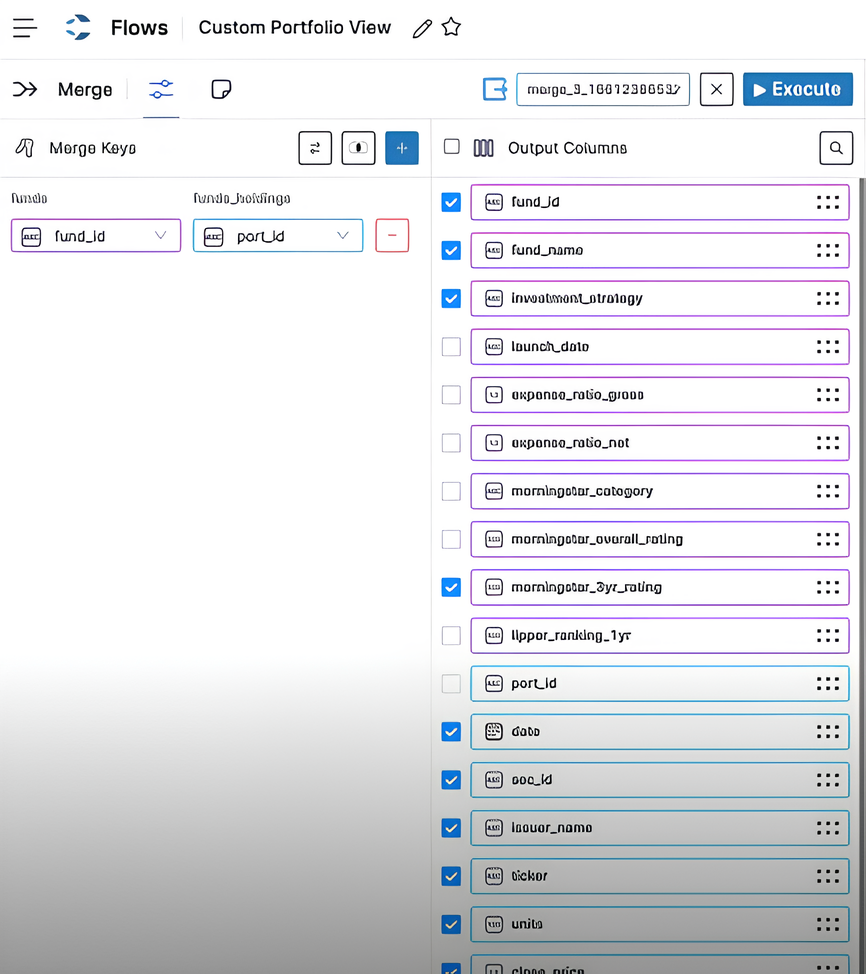
- Within Flows, fundamental data manipulations such as Merge, Split, and Filters are readily available as draggable transformers. Users can simply drag these functionalities onto the canvas, adjust minimal configurations, connect them to the data source, and execute to obtain desired results.
My Role & Responsibilities
In this project, I played a role as a Frontend Lead, where I closely collaborated with stakeholders, UX designers, and developers.
My responsibilities included:
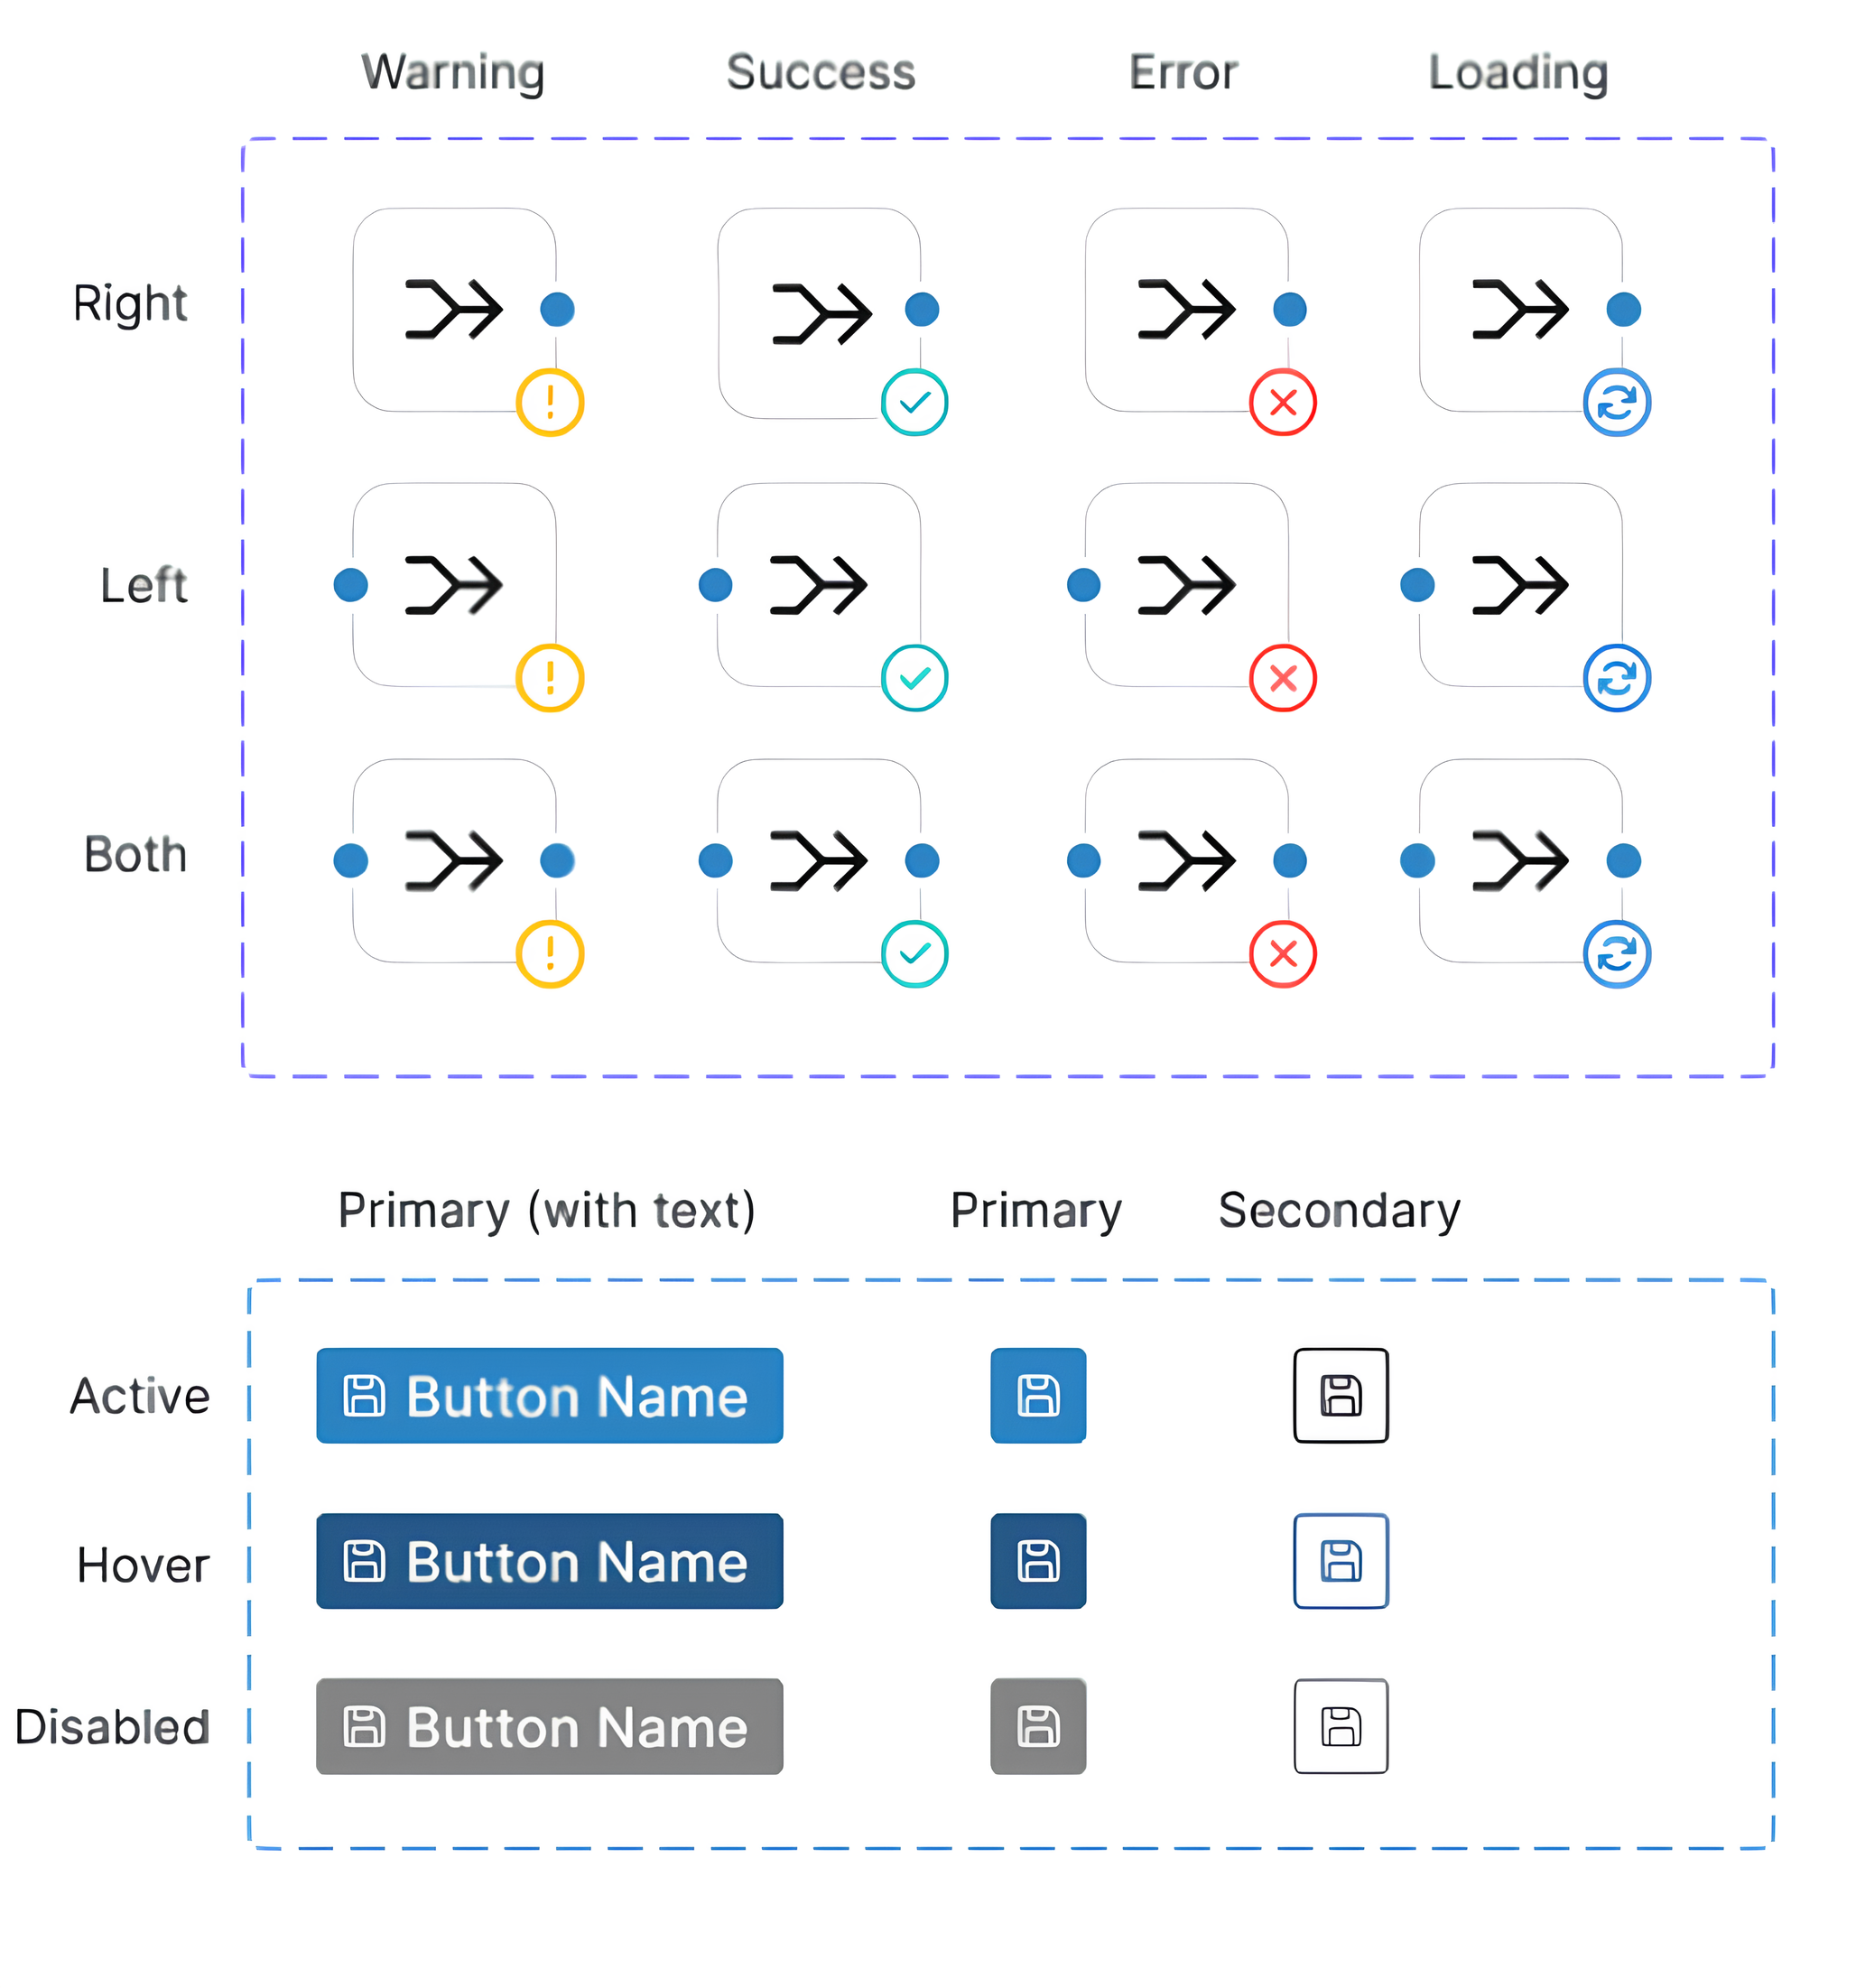
- Implementing the design system using React components and Bootstrap, providing developers with a library of reusable components.
- Tackling technical challenges and coding prototypes using React JS, leveraging NPM libraries.
- Developing comprehensive technical documentation to guide interaction with the prototype.
- Assisting UX designers in conducting user testing through prototypes and iteratively refining the prototype based on feedback.
Prototype Design
Given the technical complexity and dynamic nature of this feature, we encountered numerous technical challenges that required careful attention to transform the design concept into a functional product.
Drag-&-Drop UI Library
To implement a drag-and-drop-based UI, I explored several NPM libraries and ultimately chose react-flow-chart. Although this library provided a solid foundation, significant customization was necessary to align with our project's specific requirements.
Backend Integration
Given the requirement for the backend to initiate a session for each flow and allocate resources for processing, we developed a series of APIs to efficiently manage these sessions. The API functionalities encompassed:
- APIs dedicated to storing and retrieving graphs from the database. We adopted a JSON format to store graph information, representing it as a Directed Acyclic Graph (DAG).
- APIs aimed at configuring each transformer, recognizing that each transformer possesses a distinct set of input and output parameters.
- APIs facilitating the execution of transformers and ensuring synchronization of execution statuses between the backend and frontend components.
- APIs for authorizing permissions implemented through Role-Based Access Control (RBAC) mechanisms.

Data Preview
Given users' need for handling large datasets, the data preview module must efficiently manage significant data volumes while offering features for easy access and understanding. Included features are:
- Implementing lazy loading via infinite scrolling to present large datasets in smaller, manageable portions.
- Offering the ability to hide unwanted columns, streamlining the display and focusing on relevant data.
- Providing options to apply filters based on specific criteria and logical operators, allowing for the creation of complex conditions.
- Enabling data export to CSV, Excel, or JSON formats for further analysis.
Reflection and Impact
Building a coded prototype had a significant impact on the project in several key ways:

User Testing and Feedback Collection
The design team was able to kickstart user testing and feedback collection, leading to valuable insights for iterative improvements.

Understanding User Flow & Interactions
The development team gained a clear understanding of user flow and interactions, facilitating timeline creation and project planning.

Stakeholder Visualization
Stakeholders were able to visualize the final product, boosting confidence and support for the project.

Feasibility Assessment
The feasibility of implementing design concepts and interactions was assessed, allowing for early identification of technical challenges.

Communication Facilitation
The prototype served as a tangible reference point for communication between design, development teams, and stakeholders, streamlining collaboration.

Risk Mitigation
Potential issues were uncovered early in the process, mitigating development risks and allowing for adjustments to be made promptly.
Conclusion
Overall, building a coded prototype proved instrumental in driving the project forward, enabling various teams to collaborate effectively, validating concepts, and ultimately mitigating risks associated with development.